Critical Minerals and the Frontier Economy Opportunity
China controls the processing, not the geology. For frontier economies, this distinction is the foundation of strategic leverage in the most consequential supply chain realignment of the decade.
The Emerging Market Opportunity in Critical Minerals
The global critical minerals landscape is undergoing its most significant structural shift since the rare earth crisis of 2010-2011. Then, China's temporary export restrictions on rare earth elements caused prices to spike 2,000% and triggered a decade of Western supply chain anxiety. Today, the anxiety is more acute, the supply concentration is deeper, and the Western response is more financially committed -- but the fundamental dynamic is the same: China controls the processing, and everyone else needs it.
"China does not control the world's mineral deposits. It controls the world's mineral processing. This distinction is the foundation of frontier economy leverage."
For frontier economies, this is not primarily a threat to be managed. It is an opportunity to be seized. Western governments have concluded that supply chain dependence on a strategic competitor is unacceptable, and they are willing to pay -- in infrastructure investment, technology transfer, development finance, and premium pricing -- to reduce that dependence. The question for frontier economies is not whether Western partners will come, but on what terms they can be engaged.
This report argues that frontier economies with critical mineral endowments are in a structurally stronger negotiating position than at any point in the post-colonial era. The combination of Western supply chain urgency, Chinese export control escalation, and the energy transition's insatiable demand for specific elements creates a window -- not unlimited, but real and currently open -- for frontier economies to extract substantially better terms than historical precedent would suggest.
The window is defined by two constraints. First, Western supply chain diversification will eventually succeed, compressing the geopolitical premium that currently inflates ex-China prices. Second, Chinese processing infrastructure, once established in a frontier economy, creates path dependencies that are difficult to reverse. Frontier economies that move quickly, negotiate strategically, and demand processing technology transfer will capture permanent development gains. Those that wait, or accept terms that replicate the extractive models of the past, will find the window has closed.
Global Supply Landscape: Established, Frontier, and China-Entrenched
The map presents the full spectrum of critical minerals geopolitics. Blue countries represent the established Western supply base; dark green marks the four recommended frontier markets; light green identifies additional high-potential sites; red marks countries where China has established deep footholds; orange marks contested or mixed-engagement jurisdictions.


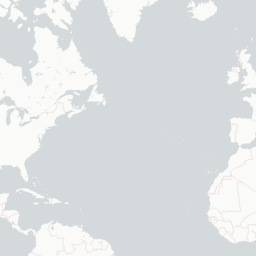

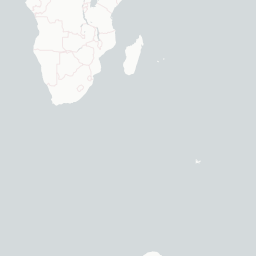


Source: CEE Critical Element Project, 2025. Contestability scores reflect mineral endowment, ownership structure, fiscal terms, infrastructure access, and political risk.
Sources: USGS Mineral Commodity Summaries 2024; IEA Critical Minerals Outlook 2025; S&P Global Market Intelligence. Hover over countries for detail.
The Unified Critical Elements Framework: A Functional Definition
The proliferation of national critical minerals lists -- the US has one, the EU has one, Australia has one, Japan has one, and the UK has one -- has created definitional fragmentation that undermines coordinated Western supply chain policy. Lists overlap but do not align; elements appear on some lists but not others; criteria differ across jurisdictions; and frontier economies face inconsistent signals about which minerals attract premium pricing and allied development finance.
The Unified Critical Elements Framework addresses this fragmentation by applying a consistent seven-criterion methodology across 63 elements, producing a four-tier classification that reflects strategic importance rather than political negotiation. The framework is designed to be jurisdiction-neutral: it identifies elements that are critical to Western industrial and defence capability regardless of which national list they appear on.
Elements where Western industrial and defence capability is directly dependent on non-substitutable supply, with processing almost entirely concentrated in China (80-99%). These command the highest geopolitical premiums.
Dysprosium · Terbium · Gallium · Germanium · Neodymium · Praseodymium · Holmium · Erbium · Thulium · Lutetium · Ytterbium · Magnesium
Elements critical to specific industrial sectors where China's dominance creates significant supply risk. Limited substitution options exist or are being developed. Several are now under active Chinese export controls.
Tungsten · Bismuth · Indium · Vanadium · Antimony · Fluorspar · Scandium · Silicon Metal · Graphite (Natural) · Graphite (Synthetic) · Cobalt · Light REE · Tellurium · Selenium · Rhenium
Essential to the energy transition or digital economy where supply concentration is significant but substitution pathways exist, or where Western domestic production is advancing.
Lithium · Nickel · Copper · Manganese · Chromium · Titanium · Zinc · Tin · Molybdenum · Niobium · Platinum · Palladium · Tantalum · Phosphate · Boron · Hafnium · Zirconium
Emerging strategic importance, significant supply concentration, or specific niche applications that warrant monitoring. Include in supply agreements as option value.
Barium · Strontium · Cesium · Rubidium · Beryllium · Helium · Arsenic · Cadmium · Thallium · Iridium · Osmium · Ruthenium · Rhodium · Yttrium · Cerium · Lanthanum · Samarium · Europium · Gadolinium
China's Processing Grip: The Non-Household Names That Matter Most
Beyond lithium and cobalt -- the minerals that dominate Western media coverage -- China controls the refining of a second tier of critical elements that rarely make headlines but underpin semiconductors, defence systems, and the energy transition. These are the minerals where Western supply chain vulnerability is most acute, where export controls have already been imposed, and where frontier economy leverage is greatest.
The IEA's 2025 Global Critical Minerals Outlook found that China is the dominant refiner for 19 of the 20 minerals analysed, holding an average market share of approximately 70%. For the Tier 1 elements in the Unified Framework, the concentration is far higher -- averaging 90-99%.
China's Refining Dominance: The Hidden Chokepoints
Chinese share of global refining capacity for critical minerals beyond lithium and cobalt. Hover over each bar for strategic context and export control status.
Sources: USGS Mineral Commodity Summaries 2024; IEA Global Critical Minerals Outlook 2025; White & Case LLP; GLOBSEC; Benchmark Mineral Intelligence. Data as of 2024.
Geopolitical Cost Premia by Mineral
Western buyers' premium for non-Chinese supply, expressed as percentage above Chinese domestic price.
Premium = percentage above Chinese domestic price for equivalent purity. Sources: Benchmark Mineral Intelligence; Metal Bulletin; JOGMEC; IEA Critical Minerals Outlook 2025.
Lofdal, Namibia: The Frontier Leverage Model in Practice
The Lofdal Heavy Rare Earth Project in Namibia's Kunene Region is the most instructive current example of how frontier economies can translate critical mineral endowments into strategic leverage. Lofdal is not the largest rare earth project in the world, nor the cheapest to develop. It is, however, the most clearly positioned to capture the geopolitical premium that defines the current market moment.
Lofdal's deposit is unusual: it is one of the few non-Chinese sources of heavy rare earth elements -- specifically dysprosium and terbium -- that are essential for the high-performance permanent magnets used in EV motors and wind turbines. China controls approximately 92% of global dysprosium refining. The ex-China premium for dysprosium oxide currently sits at 263-275% above Chinese domestic prices. A 25-year Mining License has already been granted. A joint venture with JOGMEC (Japan's state-backed minerals agency) is in place, providing both allied strategic financing and a committed offtake partner.
Lofdal Project Economics and Sensitivity Analysis
After-tax NPV comparison between base case and geopolitical divergence scenarios, with price sensitivity analysis.
- Base Case NPV ($M)
- Divergent Case NPV ($M)
Sources: Namibia Critical Metals Inc. Pre-Feasibility Study (December 2025); SGS Lofdal NI 43-101 PFS Report (January 2026); Benchmark Mineral Intelligence; Crux Investor. All financial figures in USD.
Policy Implications: Six Recommendations
The following recommendations are addressed to policymakers and negotiating teams in frontier economies with critical mineral endowments. They are designed to maximise value capture during the current window of Western supply chain urgency.
Leverage Co-Located Commercial Minerals for Better Terms
Use co-located commercially viable minerals (gold, copper) as negotiating leverage to secure infrastructure investment, processing technology transfer, or higher royalty rates on critical elements. Western partners need the strategic minerals; make them finance the full value chain development in exchange for access to commercial byproducts.
Example: Namibia's Lofdal rare earths project contains co-located uranium deposits that could finance heavy rare earths extraction infrastructure.
Demand Infrastructure Financing as Deal Precondition
Make Western-financed logistics infrastructure (ports, rail, export corridors) a non-negotiable precondition for critical minerals access. Logistics represent 15-30% of costs; Western partners should bear this burden in exchange for supply security. Infrastructure remains after mining operations end, creating permanent development gains.
Example: US Trade and Development Agency financing for the Zambia-Tanzania rail corridor reduces cobalt transport costs by 40%.
Phase Beneficiation Requirements to Capture Processing Value
Allow initial concentrate exports but mandate escalating local processing requirements over 10-15 years, tied to technology transfer and joint venture commitments. Processing captures 50-60% of value; use Western supply chain urgency to negotiate mandatory capacity building that shifts value capture from extraction to refining.
Example: Indonesia's nickel export ban increased costs 35%; phased implementation would have preserved supply continuity while building domestic processing capacity.
Standardize Rent Structures to Prevent Race-to-Bottom
Establish unified royalty rates, equity participation floors, and minimum infrastructure commitments across all critical minerals deals. Prevent Western partners from playing frontier economies against each other through inconsistent terms. Standardization strengthens collective bargaining power and ensures comparable value capture across projects.
Example: Botswana's standardized diamond royalty framework enabled rapid sector growth; apply a similar approach to lithium and rare earths.
Streamline Approvals to Capture Time-Sensitive Premiums
Accelerate contract negotiations and permitting timelines to capture geopolitical premiums before supply chain diversification compresses margins. Western partners pay for certainty and speed; countries that can deliver 18-24 month approvals command higher terms than those requiring 5-7 years.
Example: Australia's 2-year critical minerals approval target positions it to capture premium pricing unavailable to slower jurisdictions.
Extract Development Financing for Metallurgical Assessments
Negotiate DFC, JBIC, or EIB funding for feasibility studies and metallurgical testing as exploratory public-private partnerships. Western development finance institutions now absorb early-stage technical risk to secure future supply access. This shifts exploration costs from host governments to Western partners while building domestic technical capacity.
Example: DFC $50M programme for critical minerals feasibility studies in frontier markets demonstrates this model is already operational.